Corias - Core Interpretation Assistance - 74, Allee de la Robertsau F-67000 Strasbourg
Phone: +33.3.88.24.24.00 - Mobile: +33.6.07.56.11.78 -
Mail: christian@corias.com
© Corias 2018 - All rights reserved.
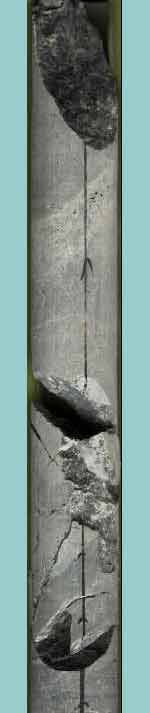
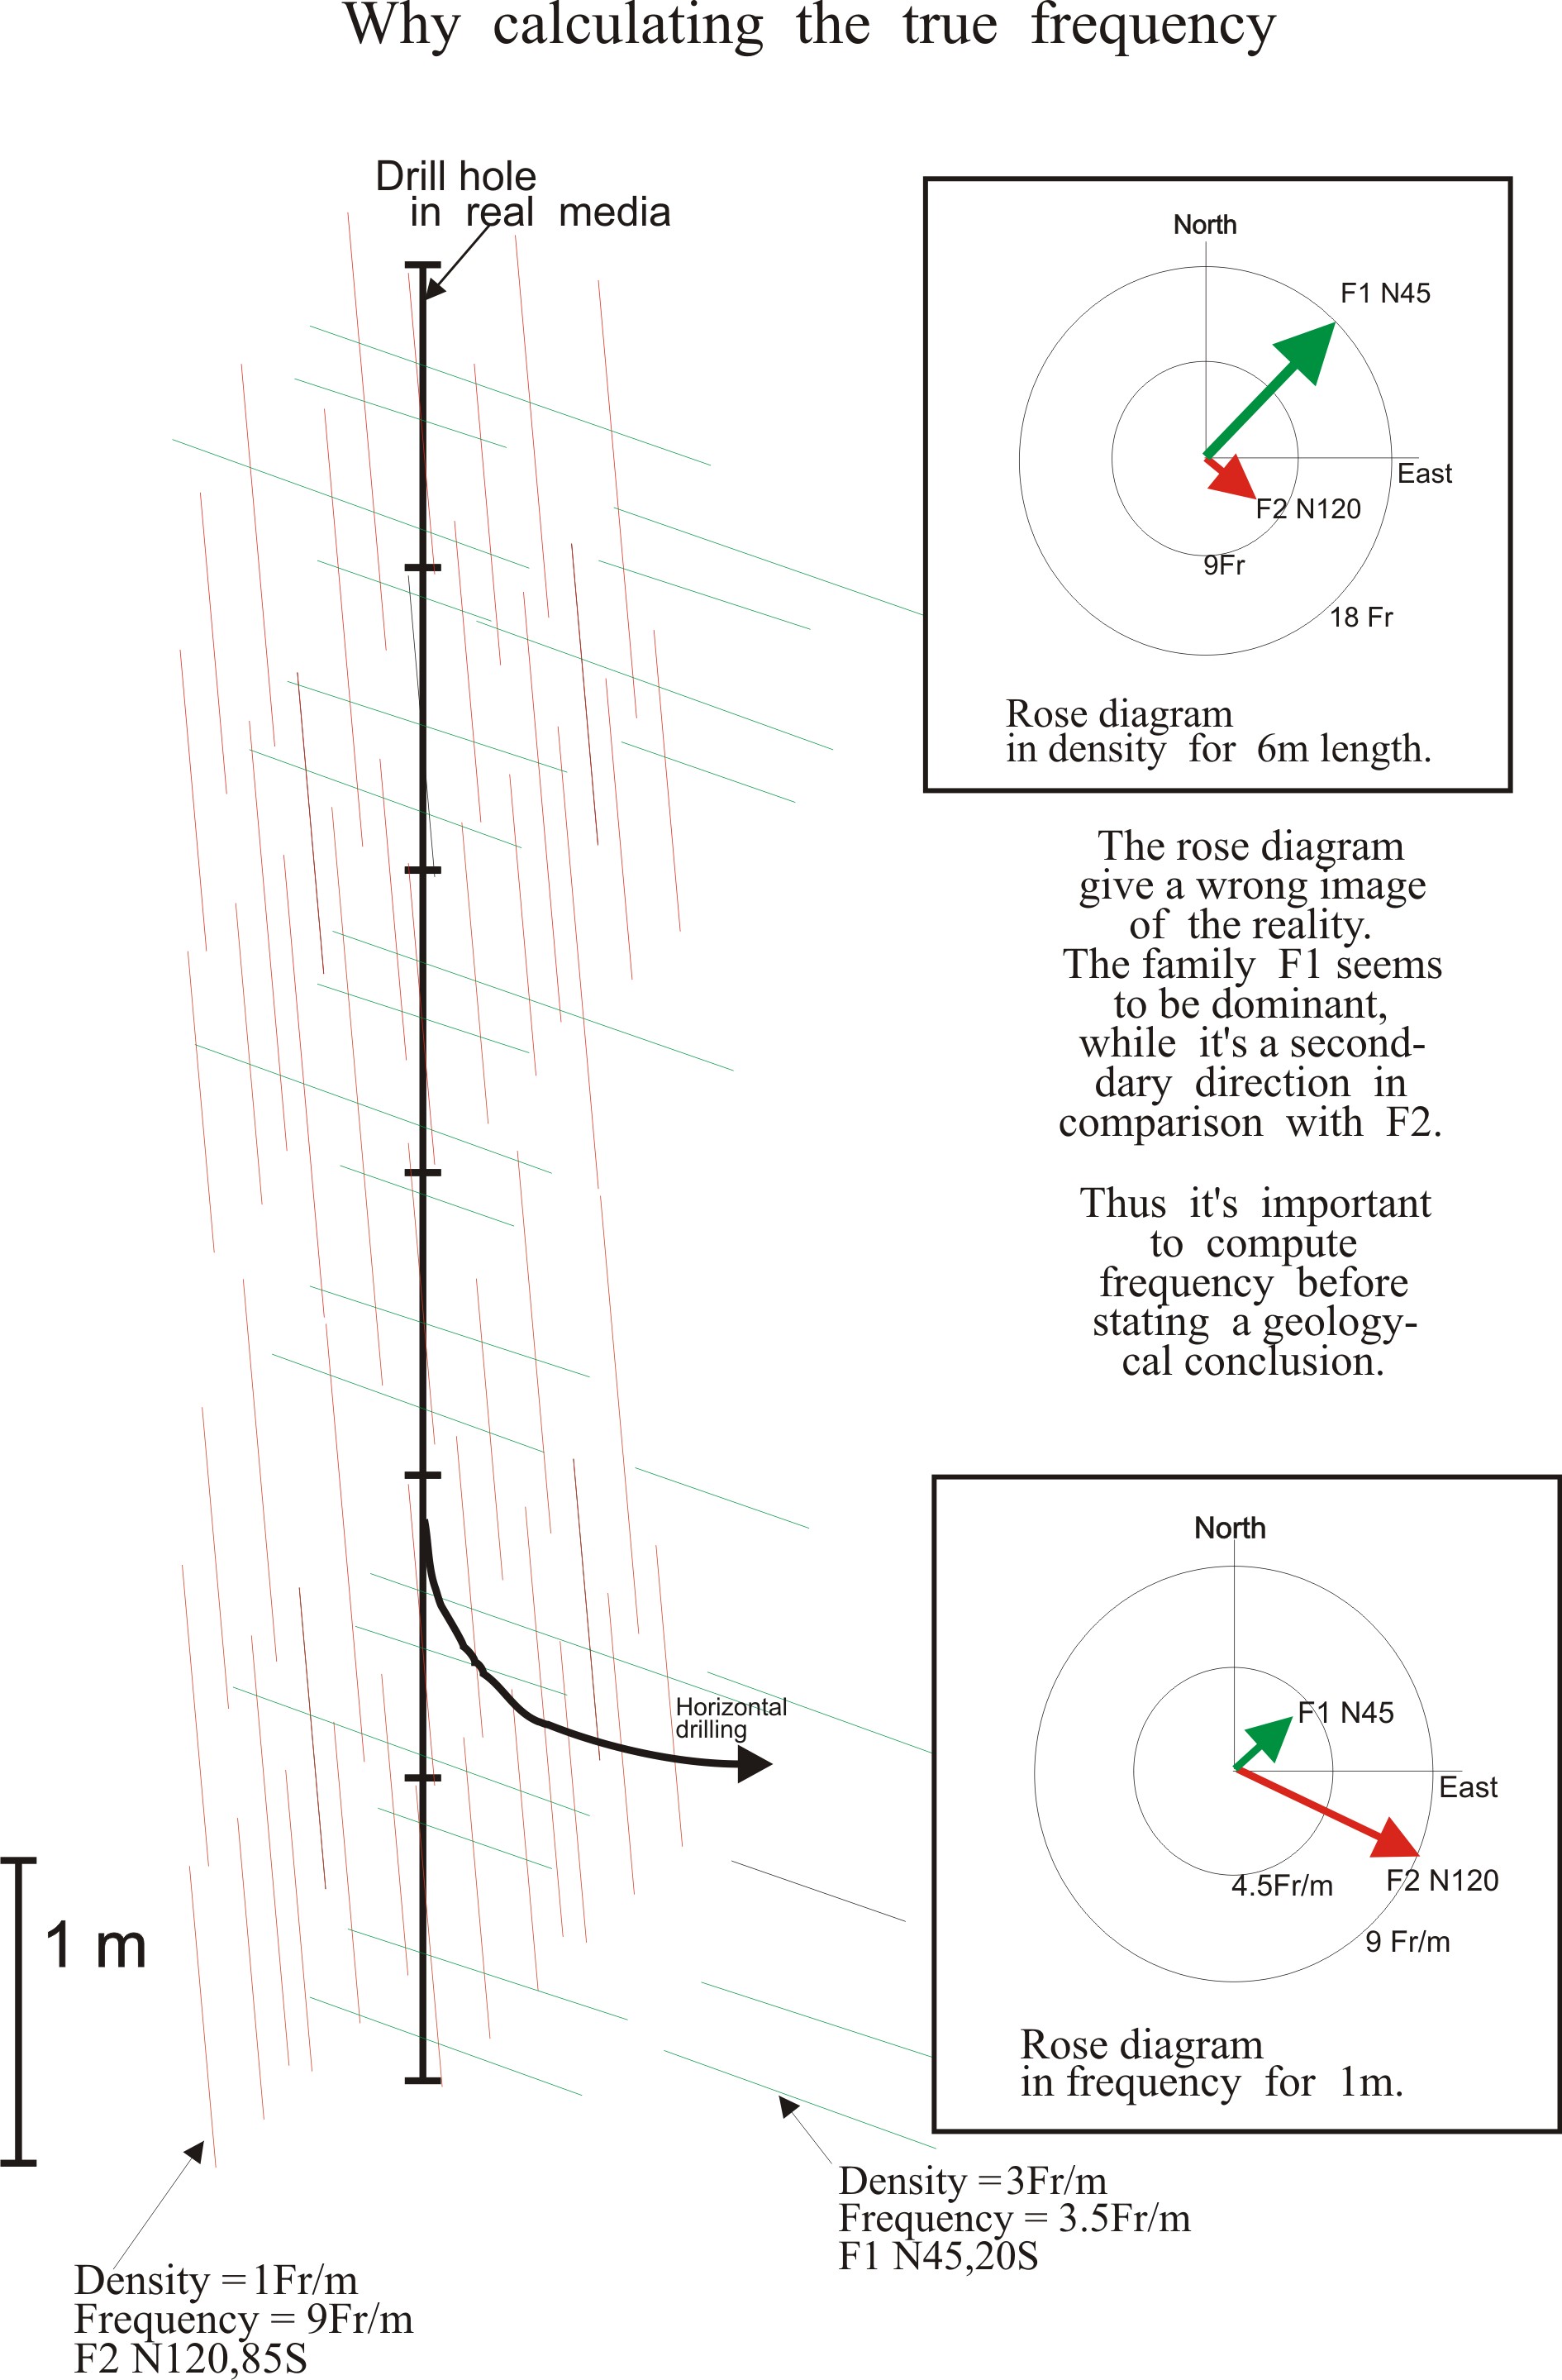
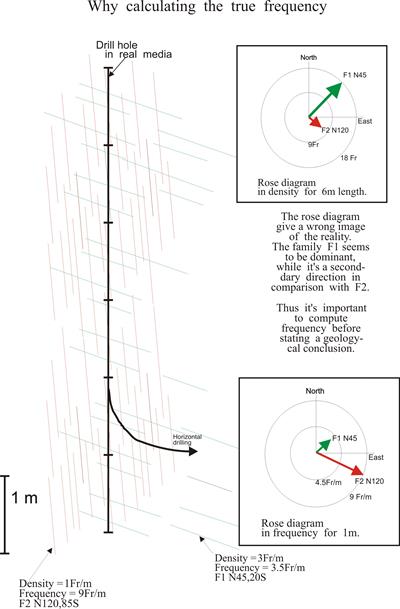
Usually, geological core studies take in account the number of fractures encounter each meter along the bore-hole in order to compute what can be called the fracture density, [frac/m]. This density information is quite often strongly biased even simply wrong when used to figure out the reality of the 3D faulted media. Let's considered the coarse faulted rock media on the figure below, two families are defined, F1 sub-horizontal and F2 sub-vertical. The rose diagram drawn on the upper right place tends to predict that the F1 direction will be the major one.
It's easy to catch from the figure that such an information is far from being reliable.
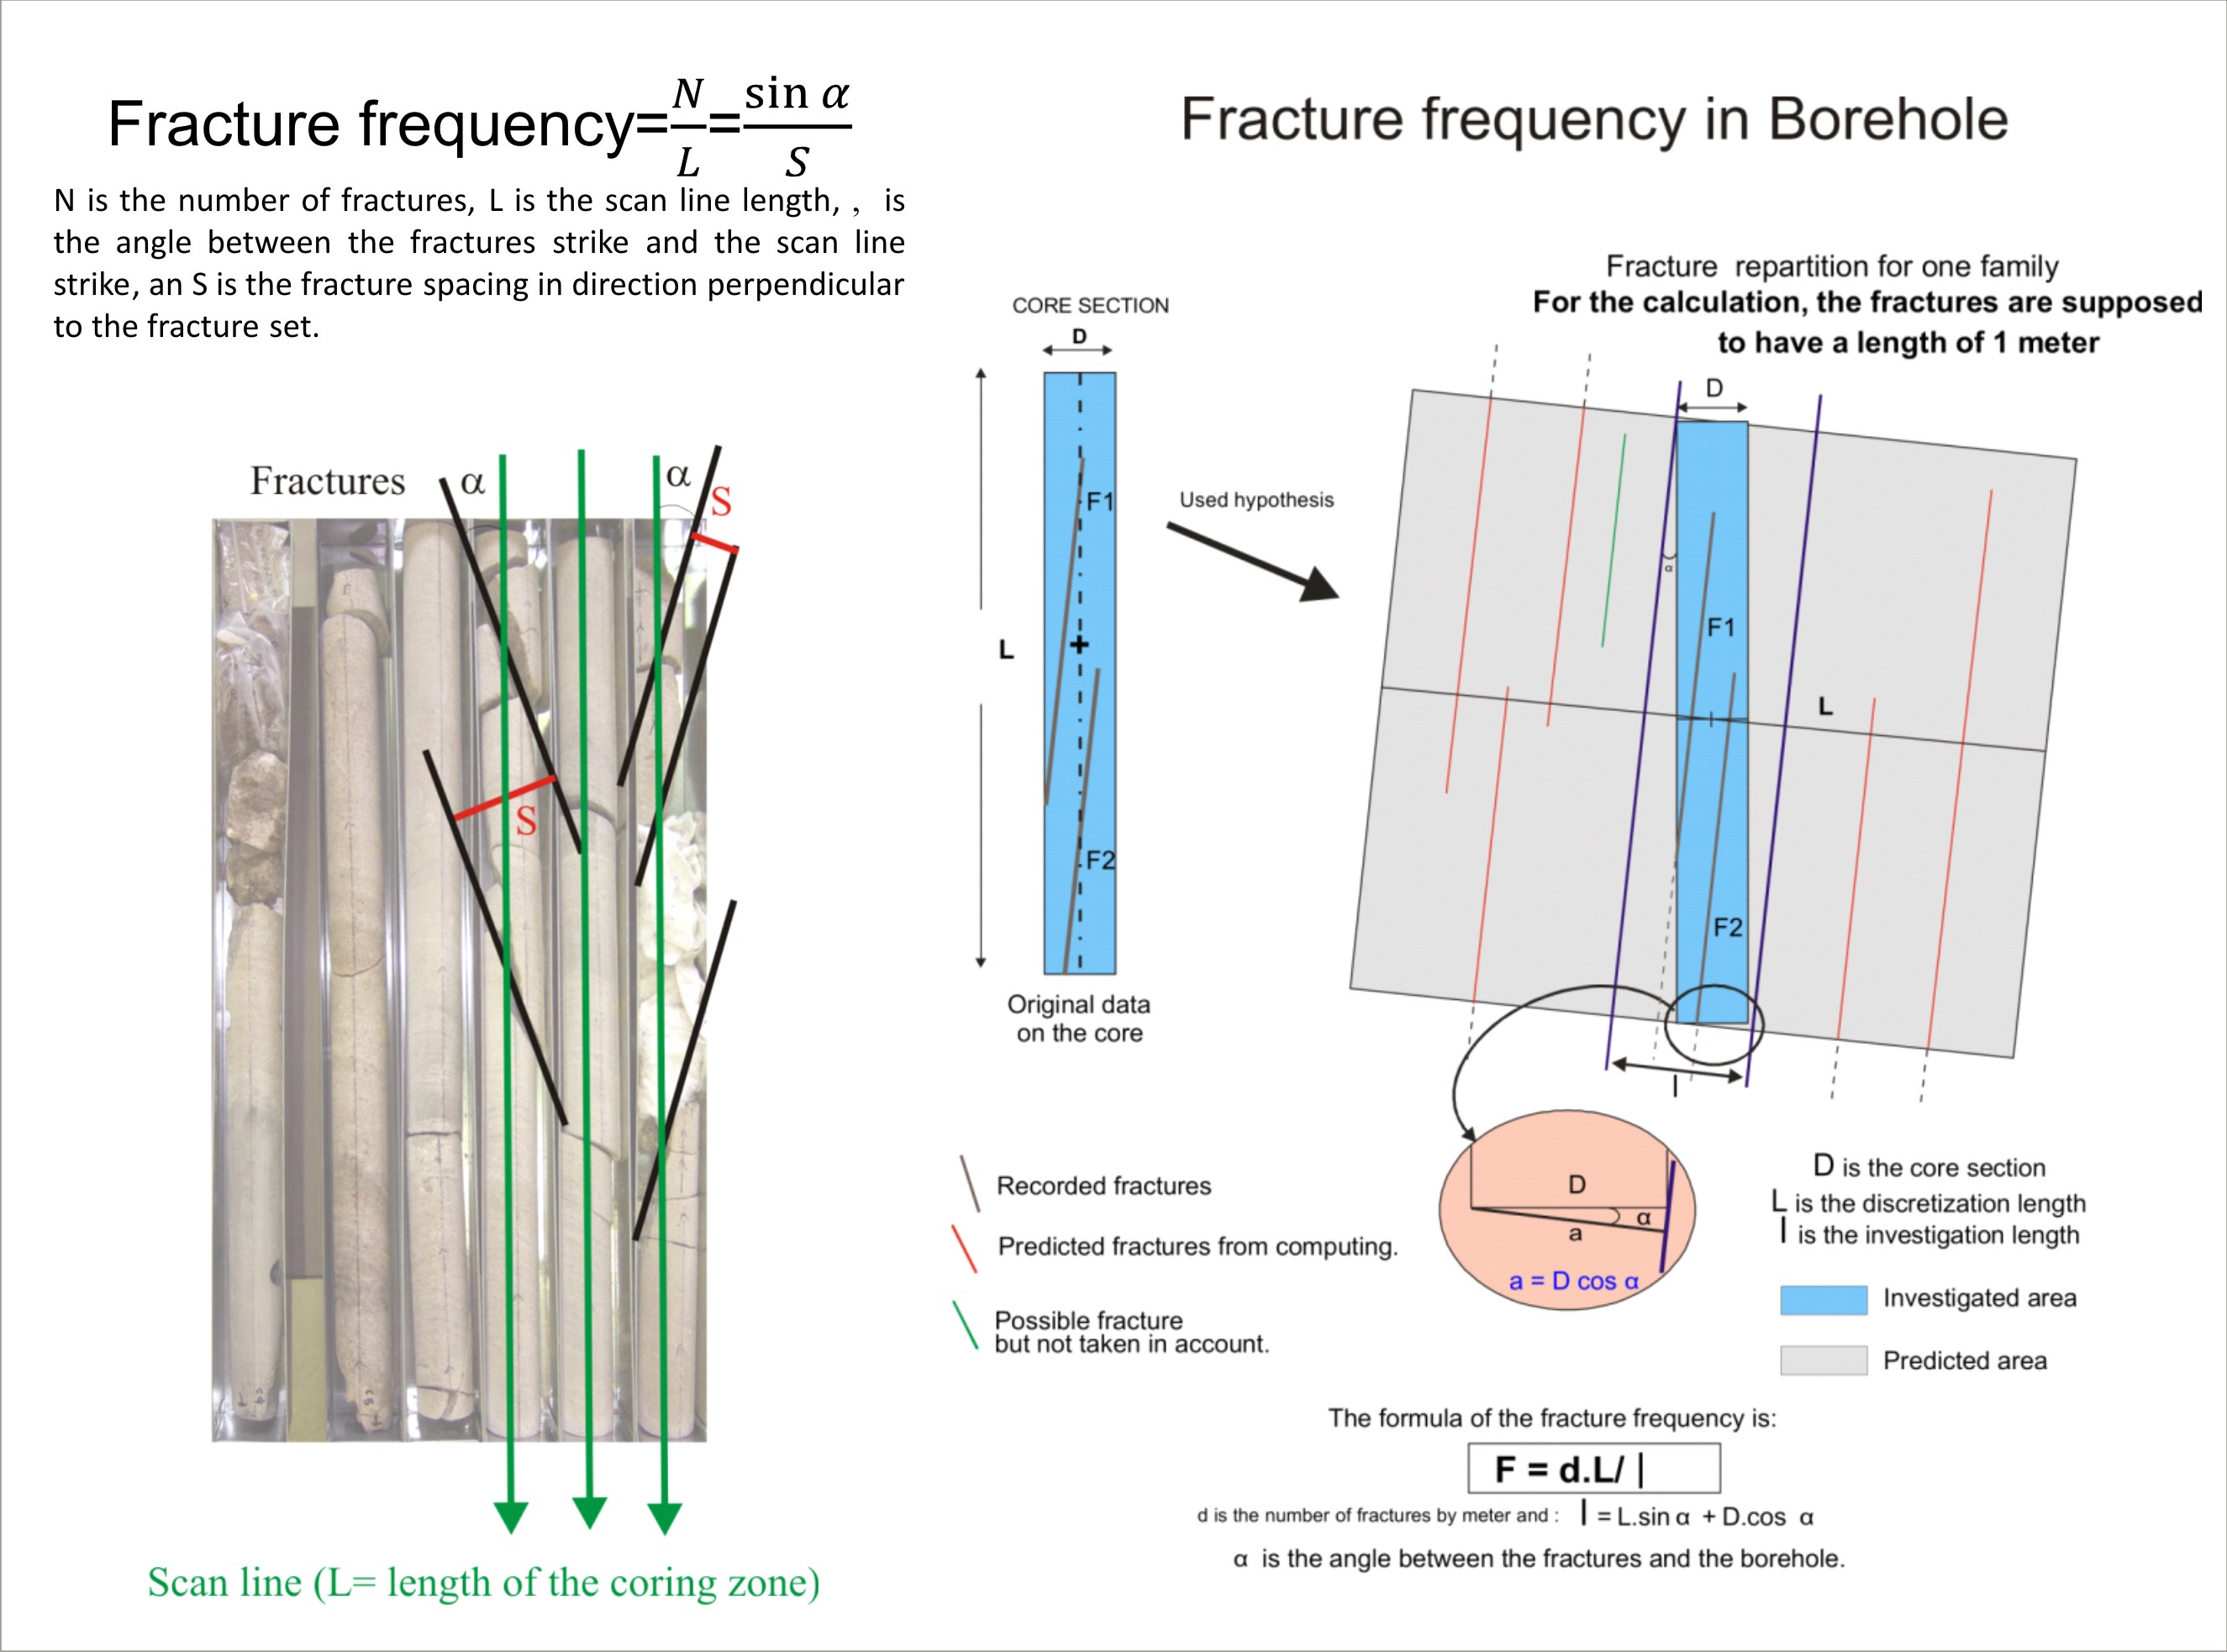
Thus, to avoid this problem, we compute what is called the fracture frequency (inverse of spacing) which is the number of fractures counted each meter perpendicularly to a specific fracture family direction.
By this way the shape of the rose diagram (down right) becomes realistic and fits quite well to the real rock media, where of course F2 family is the major fracture system in spite of F1.
An other major application of the fracture frequency is the computing of fractures porosity and permeability tensor.
Why computing fracture frequencies !!!
In a Borehole, the scan line is the well axis, but this is for 1 dimension. In borehole it is possible to take in account the well diameter, to work in 3D