Corias - Core Interpretation Assistance - 74, Allee de la Robertsau F-67000 Strasbourg
Phone: +33.3.88.24.24.00 - Mobile: +33.6.07.56.11.78 -
Mail: christian@corias.com
© Corias 2018 - All rights reserved.
CORE vs Image log
Integrating Core Data and Image Logs: The Critical Steps in Modelling a Fractured Carbonate Reservoir
We will present five case histories that describe the mapping of the fracture network using both core and borehole image data. We show how the data from the two methods can differ and how reconciliation can lead to a better understanding of the formation being studied.
Corias has analysed lots of core all over the world that has been used specifically for fracture description and structural analyses. During the course of this work there have been instances where the data from the core appeared to differ significantly from that determined from borehole images.
In order to assess the reasons for these differences a systematic study was made that allowed the comparisons of data from both direct core measurements and borehole images captured using recent tools operating with different principles
The borehole image logs (BHI) data covered recent tools, including sonic and resistivity, and combination tools that had been selected in order to capture the fracture features expected in the formations under study. All of the tools were used under optimum conditions.
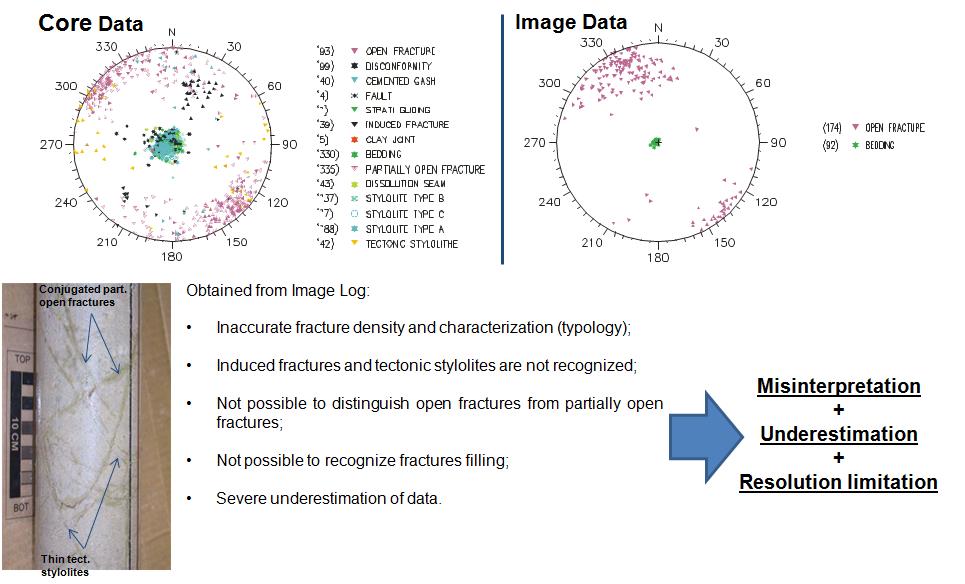
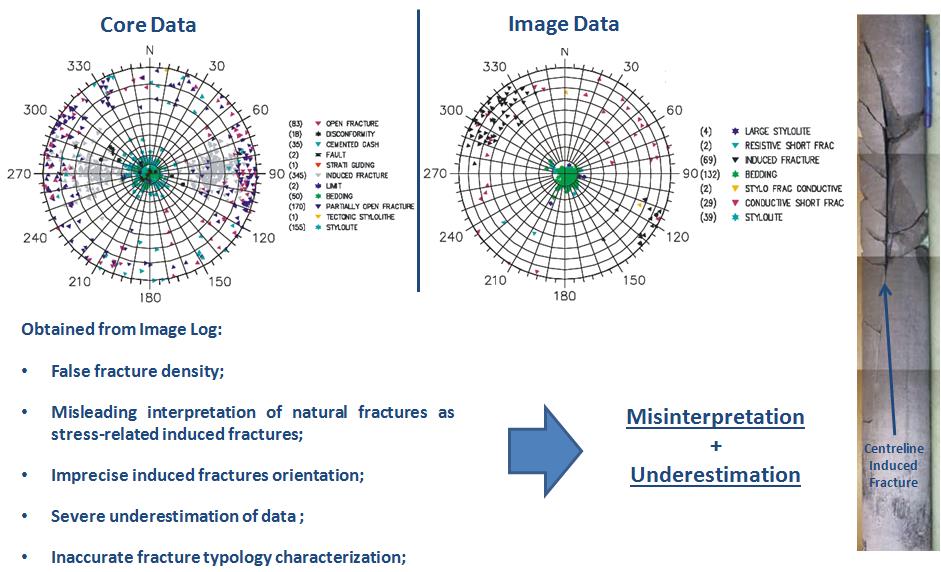
The data overleaf are the results obtained independently from BHI analysis and analysis of the core over the same interval. The most obvious difference between the data sets is that the core data is a much richer data set as the BHI could not be used to identify fracture type.
In addition, all of the fractures observed from the BHI are listed as open fractures and all are in the same orientation. One of the perennial difficulties of interpretation from BHI images is being able to differentiate between open and partially open fractures. In this instance, the BHI interpretation logged 174 instances of open fractures, while the core data showed 93 open fractures and 355 partially open fractures. The BHI images were unable to capture data from stylolites. The photograph shows conjugated partially open fractures and thin tectonic stylolites that were not observed in the BHI images. One of the reasons impacting the BHI images in this well was the well orientation. Because of the tool configuration image tools are notoriously poor at collecting data that is not in line with the well orientation.
CASE STUDY 1
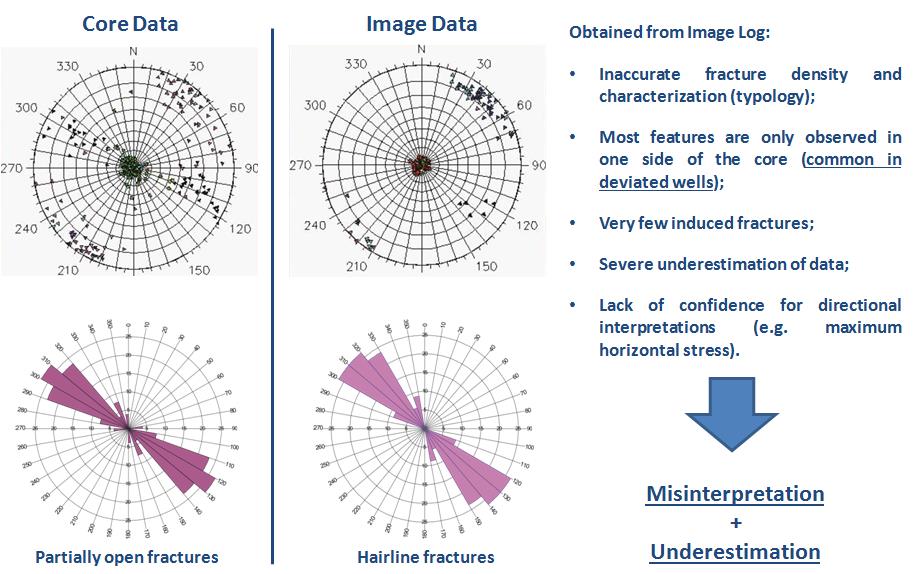
The deficiencies of BHI log data in deviated holes are apparent in the data from this well. The Stereonet plots differ in that the data from the cores show two distinct families of fracture data (open & partially open) whilst the BHI data show only open and hairline fractures.
On the BHI log the features appear only on one side of the well. There appears to be some confusion related to the nature of partially open fractures, especially when cores showed partially open fractures that exhibited a series of open/closed nature along the same fracture plane. Those were interpreted on the BHI log as Hairline series of many small fractures.
The BHI data are all consistent with the orientation of the well (N210, 37º). In addition it appears as though the BHI data and core data differ regarding the interpretation of partially filled fractures and hairline fractures.
In this well the BHI data recognise some induced fractures but as above they are those that are in line with the plane of the well. The core data are characterised by a second family of induced fractures that are 180º opposed to the data seen in the BHI. We believe that the greater density of data provide more confidence in the selection of the direction of maximum stress.
CASE STUDY 2
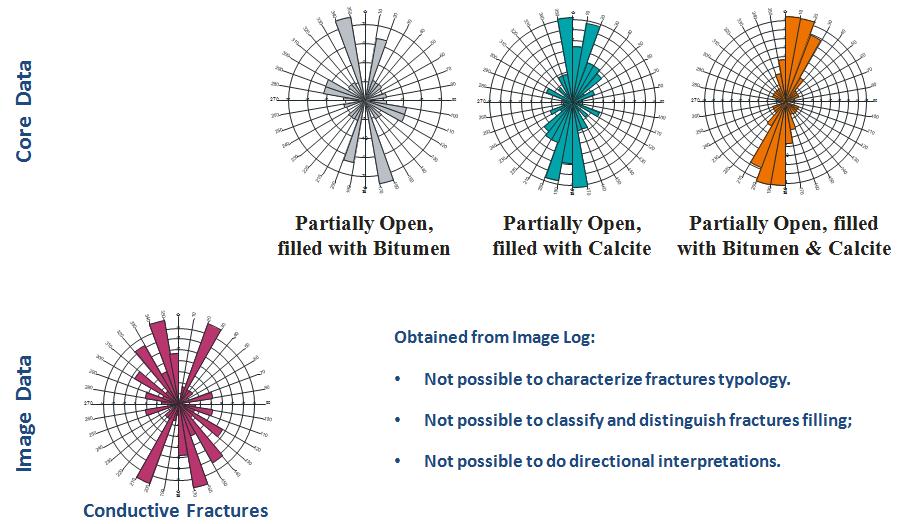
In case study 3 the BHI and core data also show some differences due to the clustering of data in the BHI image. In this instance we believe the inability to account for the nature of fracture filling materials is the root cause of this problem.
The data in Figure 5 show the full stereonet results and Figure 6 shows the fracture filling mineralization as obtained from the core data. On BHI image no distinction of the infilling material is possible. In general, infilling material is sometimes confused with host rock response due to low resistivity contrasts.
In several intervals on the BHI log there was also some confusion that caused misinterpretation of natural fracture features that appeared as oil-bleeding fractures on the studied cores ( Figure 7 ), and which were reported as stress-related induced fractures.
CASE STUDY 3
Figure 5: Core Stereonet Plot shows all open & partially open fractures. On BHI, 1148 Stylolites were not plotted to make the diagram clearer because those Stylolites features were confused with all other sedimentary and fracture features.
Figure 6: Core strike rose diagrams showing open fractures, partially open fractures and filling material. BHI strike rose diagrams showing only conductive and stylolite related fractures.
Figure 7: Many Natural "En Echelon' fractures on cores reported as short induced fractures on BHI log.
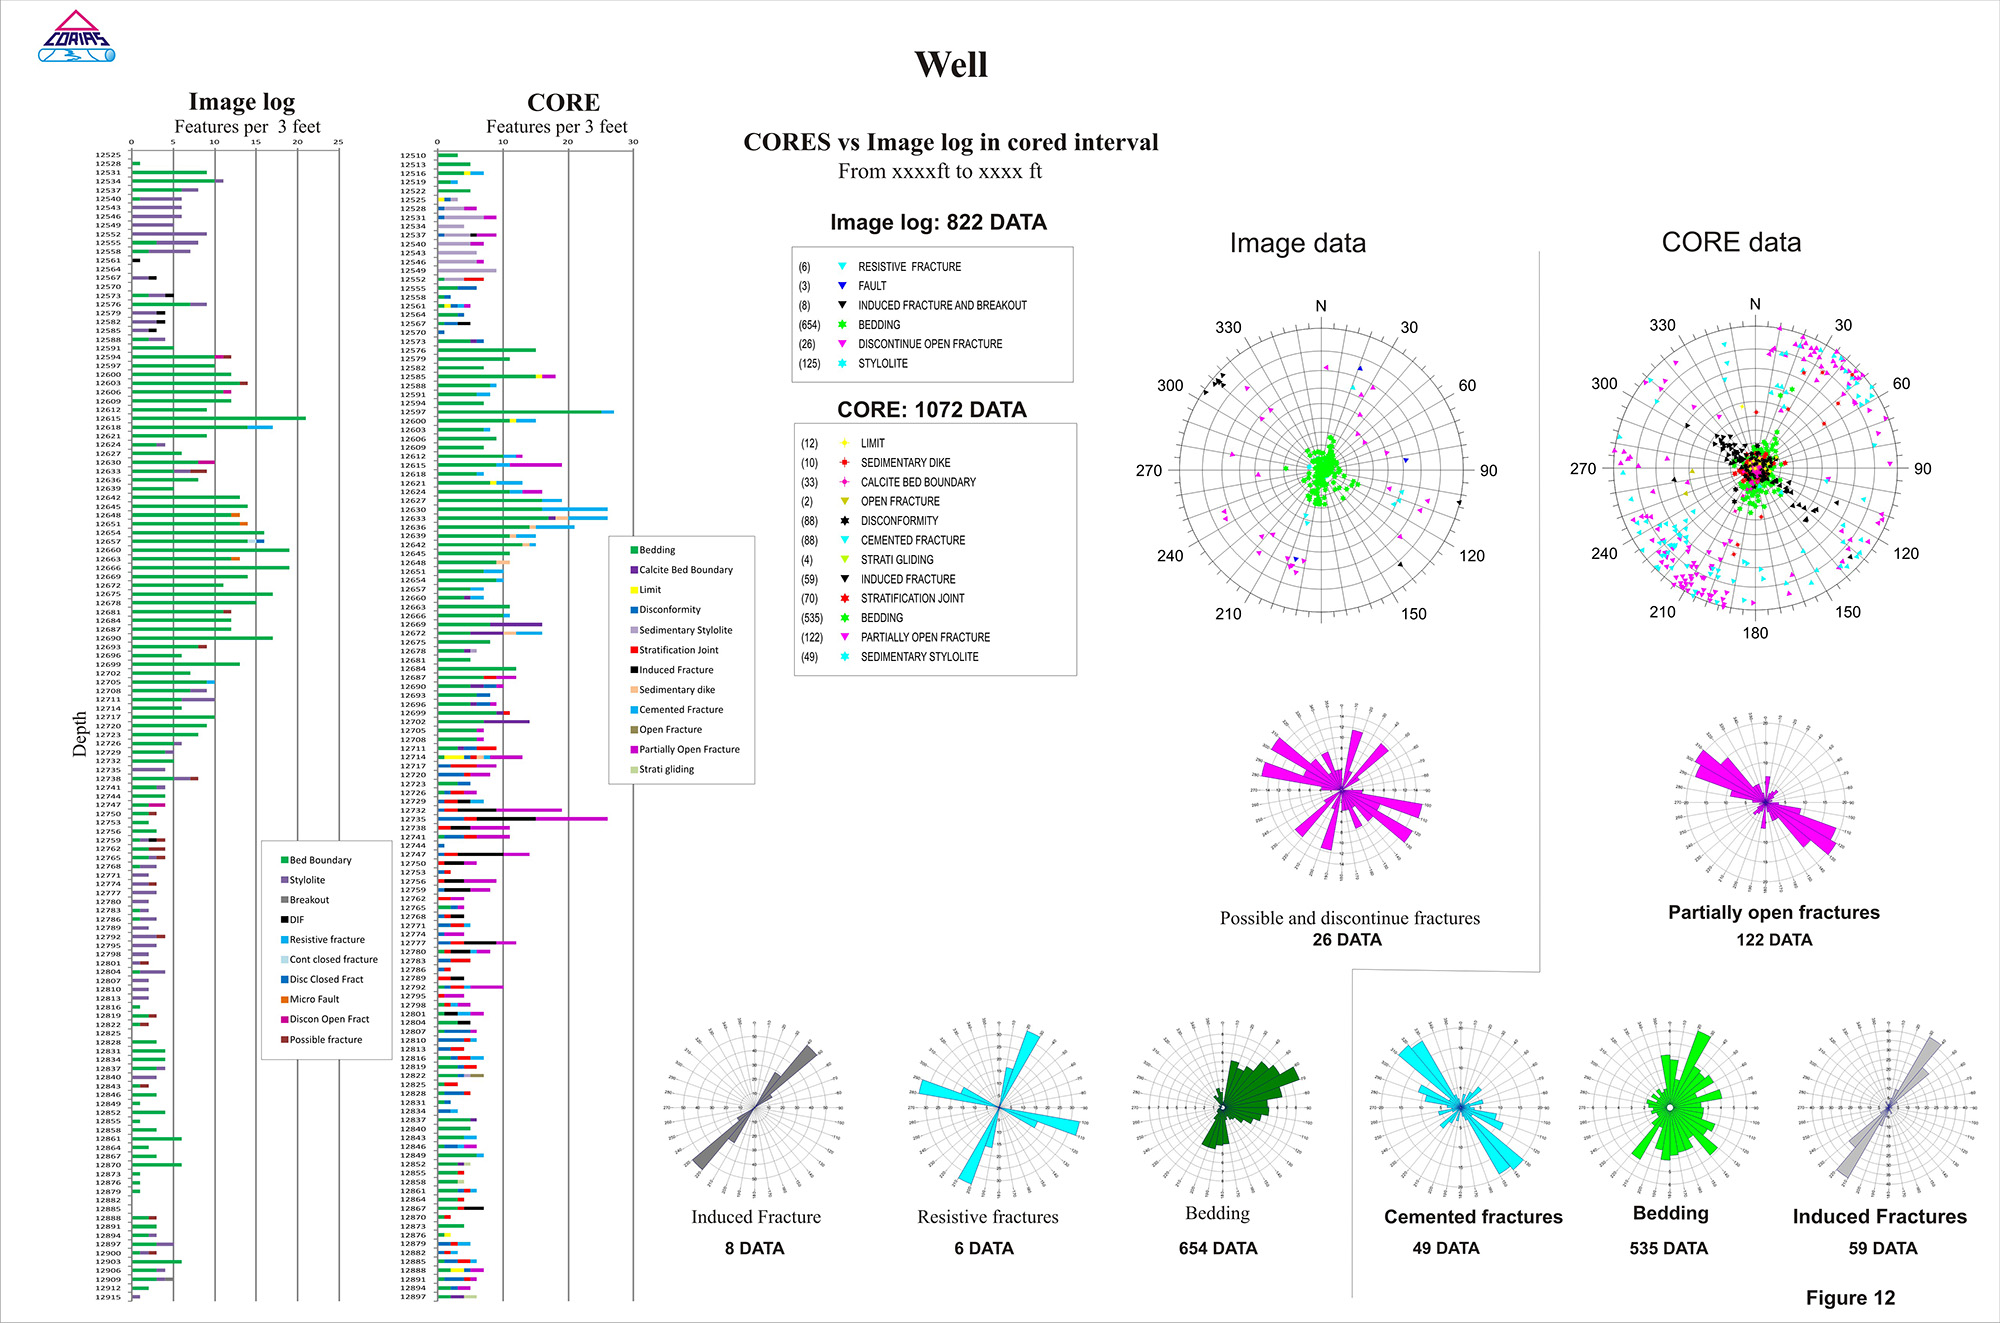
In many of the oil fields the presence of fractures can be the characteristic that defines the flow of fluids within the system. Consequently the identification, description and classification of fractures in such fields are essential to effective formation evaluation and production planning. In all of our analysis we include a comparison study between core data and image log data (when available) to complete the report. Beside is an example of such synthesis figure.